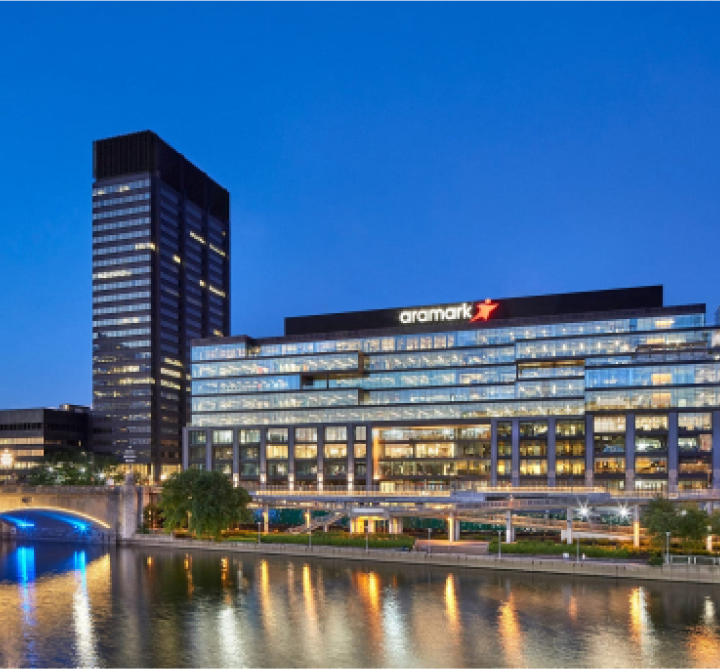
Company Posts Continued Sales and Profit Growth Momentum
Aramark (NYSE: ARMK), the $14 billion global provider of award winning services in food, facilities management, and uniforms, today reported third quarter 2014 results with strong sales and profit growth and increased its earnings outlook for fiscal 2014.
KEY HIGHLIGHTS
- Sales in the third quarter of $3.6 billion, with organic growth of 4%;
- Adjusted operating income in the third quarter of $192.4 million up 10%, operating income of $141.3 million;
- Adjusted earnings per share in the third quarter of $0.32, earnings per share of $0.19;
- Sales year-to-date of $10.9 billion, with organic growth of 5%;
- Adjusted operating income year-to-date of $649.7 million up 11%, operating income of $419.3 million;
- 2014 Adjusted Earnings per Share expectation increased to$1.45-$1.50.
"I am pleased to report another quarter of strong business results achieved within a challenging consumer and economic environment," said Eric J. Foss, President and Chief Executive Officer. "Our performance reflects solid execution against a sound strategy and was broad-based across the segments and geographies of our portfolio. Based upon this strength and our overall business momentum, we are increasing our full-year 2014 earnings outlook."
THIRD QUARTER RESULTS
Sales were $3.6 billion versus $3.5 billion in the third quarter of 2013, with organic growth of 4%. Adjusted operating income was$192.4 million versus $175.5 million in last year's period, an increase of 10%.
Adjusted net income for the quarter was $77.8 million or $0.32 per share, versus adjusted net income of $59.4 million or $0.28 per share in the third quarter of 2013. The diluted share count in the third quarter was 243.7 million shares, up from 208.3 million shares in the same period last year, primarily as a result of the company's initial public offering this past December.
On an as reported basis for the quarter, sales were $3.6 billion, operating income was $141.3 million, net income was $46.9 millionand earnings per share were $0.19. Changes in currency rates from the prior year reduced sales and operating income in the quarter. A reconciliation of as reported financial measures to adjusted financial measures, including changes in currency translation rates is presented below. See "Non-GAAP Measures."
THIRD QUARTER SEGMENT RESULTS
Food and Support Services – North America
Sales in the Food and Support Services – North America segment were $2.5 billion, up 4% on an organic basis (up 3% on a reported basis) and adjusted operating income for the segment was up 10% (operating income up 31%). Sales growth in the Education, Healthcare and Sports, Leisure and Corrections sectors were particularly notable as new business wins continue to come online.
Food and Support Services - International
Sales in the Food and Support Services - International segment were $765.2 million, a 6% increase on an organic basis (up 5% on a reported basis) and adjusted operating income for the segment was up 22% (operating income up 28%). Growth in Europe showed continued improvement from the prior year, and emerging markets continued to grow in the double digits during the third quarter. The company was proud to have served as the food service provider to 3 million fans at 12 different venues during the FIFA World Cup tournament in Brazil this quarter.
Uniform and Career Apparel
Sales in the Uniform and Career Apparel segment were $367.1 million, up 3% on an organic basis (up 3% on a reported basis) and adjusted operating income for the segment was up 8% (operating income up 32%). Profitability improvement in the segment was driven by ongoing sales growth and continuing merchandise and plant productivity initiatives.
Declaration of Dividend
On August 6, 2014, the company's Board of Directors declared a7.5 cent dividend per share of common stock, payable onSeptember 9, 2014, to shareholders of record at the close of business August 19, 2014.
LIQUIDITY & CAPITAL STRUCTURE
As of June 27, 2014, total debt was $5.7 billion, a reduction of approximately $525 million from the year prior. The company's total debt to adjusted EBITDA ratio has been reduced to 4.6x, from 5.3x in June 2013. Corporate liquidity remains strong, and as of quarter-end the company had $591.4 million of available borrowing capacity on its $770.0 million revolving credit facility.
OUTLOOK
The company has previously provided a multi-year annual framework that contemplates:
- Organic Sales growth of 3% to 5% annually;
- Adjusted Operating Income growth in the mid- to upper-single digits on a percentage basis, and;
- Adjusted EPS growth in the low double digits on a percentage basis.
Based upon third quarter results, the company is raising its expected 53-week adjusted earnings per share range to $1.45-$1.50 for fiscal 2014.
CONFERENCE CALL SCHEDULED
The company has scheduled a conference call at 10 a.m. Eastern Daylight Time today to discuss its earnings. This call can be heard, either live or on a delayed basis, on the company's web site,www.aramark.com on the investor relations page.
Selected Operational and Financial Metrics
Adjusted Sales (Organic)
Management believes that presentation of sales growth, adjusted to eliminate the effects of acquisitions and divestitures and the impact of currency translation, provides useful information to investors because it enhances comparability between the current year and prior year reporting periods. Elimination of the currency translation effect provides constant currency comparisons without the distortion of currency rate fluctuations.
Adjusted Operating Income
Adjusted operating income represents operating income adjusted to eliminate the change in amortization of acquisition-related customer relationship intangible assets and depreciation of property and equipment resulting from the going-private transaction in 2007 (the "Transaction"); the impact of the change in fair value related to the gasoline and diesel agreements; severance and other charges; share-based compensation; the effects of acquisitions and divestitures and the impact of currency translation and other items impacting comparability.
Adjusted EBITDA
Adjusted EBITDA represents Adjusted Operating Income further adjusted to exclude the impact of all other depreciation and amortization expense.
Adjusted Net Income
djusted Net Income represents net income adjusted to eliminate the impact of discontinued operations; the change in amortization of acquisition-related customer relationship intangible assets and depreciation of property and equipment resulting from the Transaction; the impact of changes in the fair value related to the gasoline and diesel agreements; severance and other charges; share-based compensation; the effects of acquisitions and divestitures and the impact of currency translation and other items impacting comparability, less the tax impact of these adjustments. Management believes that presentation of net income as adjusted is useful information to investors because we use such information when evaluating net income to better evaluate the underlying operating performance of the company.
We use Adjusted Sales, Adjusted Operating Income, Adjusted EBITDA and Adjusted Net Income as supplemental measures of our operating profitability and to operate and control our cash operating costs to evaluate our performance. These financial metrics are not measurements of financial performance under generally accepted accounting principles in the United States, or U.S. GAAP. We believe the presentation of these metrics is appropriate to provide additional information to investors about our operating performance. Our presentation of these metrics has limitations as an analytical tool, and should not be considered in isolation or as a substitute for analysis of our results as reported under U.S. GAAP. You should not consider these measures as alternatives to sales, operating income or net income, determined in accordance with U.S. GAAP. Adjusted Sales, Adjusted Operating Income, Adjusted EBITDA and Adjusted Net Income, as presented by us, may not be comparable to other similarly titled measures of other companies because not all companies use identical calculations.
ARAMARK AND SUBSIDIARIES
CONDENSED CONSOLIDATED STATEMENTS OF INCOME
(Unaudited)
(In Thousands, Except Per Share Amounts)
Three Months
Three Months
Ended
Ended
June 27, 2014
June 28, 2013
Sales
$ 3,620,057
$ 3,490,030
Costs and Expenses:
Cost of services provided
3,275,409
3,178,092
Depreciation and amortization
124,917
135,808
Selling and general corporate expenses
78,448
52,534
3,478,774
3,366,434
Operating income
141,283
123,596
Interest and other financing costs, net
71,186
80,917
Income before income taxes
70,097
42,679
Provision for income taxes
23,181
14,705
Net income
46,916
27,974
Less: Net income attributable to noncontrolling interests
43
226
Net income attributable to Aramark stockholders
$ 46,873
$ 27,748
Earnings per share attributable to Aramark stockholders:
Basic
$0.20
$0.14
Diluted
$0.19
$0.13
Weighted Average Shares Outstanding:
Basic
231,854
201,364
Diluted
243,739
208,326
ARAMARK AND SUBSIDIARIES
CONDENSED CONSOLIDATED STATEMENTS OF INCOME
(Unaudited)
(In Thousands, Except Per Share Amounts)
Nine Months
Nine Months
Ended
Ended
June 27, 2014
June 28, 2013
Sales
$ 10,885,145
$ 10,429,682
Costs and Expenses:
Cost of services provided
9,790,036
9,481,859
Depreciation and amortization
387,058
404,512
Selling and general corporate expenses
288,739
164,181
10,465,833
10,050,552
Operating income
419,312
379,130
Interest and other financing costs, net
256,613
341,392
Income before income taxes
162,699
37,738
Provision for income taxes
57,750
6,476
Net income
104,949
31,262
Less: Net income attributable to noncontrolling interests
398
804
Net income attributable to Aramark stockholders
$ 104,551
$ 30,458
Earnings per share attributable to Aramark stockholders:
Basic
$0.47
$0.15
Diluted
$0.45
$0.15
Weighted Average Shares Outstanding:
Basic
223,143
201,607
Diluted
234,822
208,703
ARAMARK AND SUBSIDIARIES
CONDENSED CONSOLIDATED BALANCE SHEETS
(Unaudited)
(In Thousands)
June 27, 2014
September 27, 2013
Assets
Current Assets:
Cash and cash equivalents
$ 122,419
$ 110,998
Receivables
1,494,709
1,405,843
Inventories
543,210
541,972
Prepayments and other current assets
194,862
228,352
Total current assets
2,355,200
2,287,165
Property and Equipment, net
988,603
977,323
Goodwill
4,619,214
4,619,987
Other Intangible Assets
1,298,407
1,408,764
Other Assets
1,013,578
973,867
$ 10,275,002
$ 10,267,106
Liabilities and Stockholders' Equity
Current Liabilities:
Current maturities of long-term borrowings
$ 104,106
$ 65,841
Accounts payable
766,450
888,969
Accrued expenses and other current liabilities
1,129,981
1,434,443
Total current liabilities
2,000,537
2,389,253
Long-Term Borrowings
5,585,603
5,758,229
Other Liabilities
959,135
1,047,002
Common Stock Subject to Repurchase and Other
10,005
168,915
Total Stockholders' Equity
1,719,722
903,707
$ 10,275,002
$ 10,267,106
ARAMARK AND SUBSIDIARIES
CONDENSED CONSOLIDATED STATEMENTS OF CASH FLOWS
(Unaudited)
(In Thousands)
Nine Months
Nine Months
Ended
Ended
June 27, 2014
June 28, 2013
Cash flows from operating activities:
Net income
$ 104,949
$ 31,262
Adjustments to reconcile net income to net cash
(used in) provided by operating activities:
Depreciation and amortization
387,058
404,512
Income taxes deferred
(46,190)
(46,454)
Share-based compensation expense
83,017
12,328
Changes in noncash working capital
(562,432)
(328,085)
Other operating activities
16,158
62,763
Net cash (used in) provided by operating activities
(17,440)
136,326
Cash flows from investing activities:
Net purchases of property and equipment,
client contract investments and other
(310,510)
(254,851)
Acquisitions, divestitures and other investing activities
12,239
2,778
Net cash used in investing activities
(298,271)
(252,073)
Cash flows from financing activities:
Net proceeds/payments of long-term borrowings
(194,933)
175,086
Net change in funding under the Receivables Facility
50,000
36,200
Payments of dividends
(34,696)
-
Proceeds from initial public offering, net
524,081
-
Proceeds from issuance of common stock
3,701
4,882
Distribution in connection with spin-off of Seamless Holdings
-
(47,352)
Repurchase of common stock
(2,085)
(38,419)
Other financing activities
(18,936)
(53,577)
Net cash provided by financing activities
327,132
76,820
Increase (decrease) in cash and cash equivalents
11,421
(38,927)
Cash and cash equivalents, beginning of period
110,998
136,748
Cash and cash equivalents, end of period
$ 122,419
$ 97,821
ARAMARK AND SUBSIDIARIES
RECONCILIATION OF NON-GAAP MEASURES
ADJUSTED CONSOLIDATED OPERATING INCOME MARGIN
(Unaudited)
(In thousands)
Three Months Ended
June 27, 2014
FSS North America
FSS International
Uniform
Corporate
Aramark and Subsidiaries
Sales (as reported)
$ 2,487,739
$ 765,206
$ 367,112
$ 3,620,057
Operating Income (as reported)
$ 95,546
$ 36,722
$ 46,857
$ (37,842)
$ 141,283
Operating Income Margin (as reported)
3.8%
4.8%
12.8%
3.9%
Sales (as reported)
$ 2,487,739
$ 765,206
$ 367,112
$ 3,620,057
Effects of Acquisitions and Divestitures
(1,380)
(928)
(548)
(2,856)
Adjusted Sales (Organic)
$ 2,486,359
$ 764,278
$ 366,564
$ 3,617,201
Operating Income (as reported)
$ 95,546
$ 36,722
$ 46,857
$ (37,842)
$ 141,283
Amortization of Acquisition-Related Customer Relationship Intangible Assets and Depreciation of Property and Equipment Resulting from the Transaction
27,847
1,727
(1,048)
-
28,526
Share-Based Compensation
674
167
348
10,122
11,311
Severance and Other Charges
(609)
754
-
7,981
8,126
Effects of Acquisitions and Divestitures
(1)
(139)
18
-
(122)
Branding
-
-
-
4,634
4,634
Gains, Losses and Settlements impacting comparability
(1,258)
-
(623)
475
(1,406)
Adjusted Operating Income
$ 122,199
$ 39,231
$ 45,552
$ (14,630)
$ 192,352
Adjusted Operating Income Margin
4.9%
5.1%
12.4%
5.3%
Three Months Ended
June 28, 2013
FSS North America
FSS International
Uniform
Corporate
Aramark and Subsidiaries
Sales (as reported)
$ 2,405,860
$ 727,516
$ 356,654
$ 3,490,030
Operating Income (as reported)
$ 73,146
$ 28,694
$ 35,388
$ (13,632)
$ 123,596
Operating Income Margin (as reported)
3.0%
3.9%
9.9%
3.5%
Sales (as reported)
$ 2,405,860
$ 727,516
$ 356,654
$ 3,490,030
Effect of Currency Translation
(15,556)
(7,199)
-
(22,755)
Effects of Acquisitions and Divestitures
(5,100)
-
-
(5,100)
Adjusted Sales (Organic)
$ 2,385,204
$ 720,317
$ 356,654
$ 3,462,175
Operating Income (as reported)
$ 73,146
$ 28,694
$ 35,388
$ (13,632)
$ 123,596
Amortization of Acquisition-Related Customer Relationship Intangible Assets and Depreciation of Property and Equipment Resulting from the Transaction
30,034
1,757
6,907
-
38,698
Share-Based Compensation
-
-
-
3,507
3,507
Effect of Currency Translation
(969)
426
-
-
(543)
Severance and Other Charges
9,875
1,201
-
-
11,076
Effects of Acquisitions and Divestitures
(1,062)
-
-
-
(1,062)
Gains, Losses and Settlements impacting comparability
(180)
-
-
373
193
Adjusted Operating Income
$ 110,844
$ 32,078
$ 42,295
$ (9,752)
$ 175,465
Adjusted Operating Income Margin
4.6%
4.5%
11.9%
5.1%
ARAMARK AND SUBSIDIARIES
RECONCILIATION OF NON-GAAP MEASURES
ADJUSTED CONSOLIDATED OPERATING INCOME MARGIN
(Unaudited)
(In thousands)
Nine Months Ended
June 27, 2014
FSS North America
FSS International
Uniform
Corporate
Aramark and
Subsidiaries
Sales (as reported)
$ 7,504,970
$ 2,284,944
$ 1,095,231
$ 10,885,145
Operating Income (as reported)
$ 384,096
$ 76,957
$ 123,716
$ (165,457)
$ 419,312
Operating Income Margin (as reported)
5.1%
3.4%
11.3%
3.9%
Sales (as reported)
$ 7,504,970
$ 2,284,944
$ 1,095,231
$ 10,885,145
Effects of Acquisitions and Divestitures
(7,847)
(1,637)
(548)
(10,032)
Adjusted Sales (Organic)
$ 7,497,123
$ 2,283,307
$ 1,094,683
$ 10,875,113
Operating Income (as reported)
$ 384,096
$ 76,957
$ 123,716
$ (165,457)
$ 419,312
Amortization of Acquisition-Related Customer Relationship Intangible Assets and Depreciation of Property and Equipment Resulting from the Transaction
87,220
4,923
6,721
-
98,864
Share-Based Compensation
674
167
348
32,255
33,444
Severance and Other Charges
(11,936)
13,862
-
20,027
21,953
Effects of Acquisitions and Divestitures
(551)
(192)
18
-
(725)
Branding
1,189
225
210
17,862
19,486
Initial Public Offering-Related Expenses, including share- based compensation
-
-
-
56,133
56,133
Gains, Losses and Settlements impacting comparability
2,409
-
(1,546)
394
1,257
Adjusted Operating Income
$ 463,101
$ 95,942
$ 129,467
$ (38,786)
$ 649,724
Adjusted Operating Income Margin
6.2%
4.2%
11.8%
6.0%
Nine Months Ended
June 28, 2013
FSS North America
FSS International
Uniform
Corporate
Aramark and Subsidiaries
Sales (as reported)
$ 7,217,759
$ 2,154,567
$ 1,057,356
$ 10,429,682
Operating Income (as reported)
$ 298,935
$ 37,877
$ 89,761
$ (47,443)
$ 379,130
Operating Income Margin (as reported)
4.1%
1.8%
8.5%
3.6%
Sales (as reported)
$ 7,217,759
$ 2,154,567
$ 1,057,356
$ 10,429,682
Effect of Currency Translation
(52,639)
(21,522)
-
(74,161)
Effects of Acquisitions and Divestitures
(13,730)
-
-
(13,730)
Adjusted Sales (Organic)
$ 7,151,390
$ 2,133,045
$ 1,057,356
$ 10,341,791
Operating Income (as reported)
$ 298,935
$ 37,877
$ 89,761
$ (47,443)
$ 379,130
Amortization of Acquisition-Related Customer Relationship Intangible Assets and Depreciation of Property and Equipment Resulting from the Transaction
89,814
6,160
20,425
-
116,399
Share-Based Compensation
-
-
-
12,328
12,328
Effect of Currency Translation
(3,904)
(659)
-
-
(4,563)
Severance and Other Charges
54,843
34,152
3,730
1,021
93,746
Effects of Acquisitions and Divestitures
(447)
-
-
-
(447)
Gains, Losses and Settlements impacting comparability
(16,721)
-
2,913
551
(13,257)
Adjusted Operating Income
$ 422,520
$ 77,530
$ 116,829
$ (33,543)
$ 583,336
Adjusted Operating Income Margin
5.9%
3.6%
11.0%
5.6%
ARAMARK AND SUBSIDIARIES
RECONCILIATION OF NON-GAAP MEASURES
ADJUSTED NET INCOME, ADJUSTED OPERATING INCOME, ADJUSTED EBITDA & ADJUSTED EPS
(Unaudited)
(In thousands, except per share amounts)
Three Months Ended
Three Months Ended
Nine Months Ended
Nine Months Ended
June 27, 2014
June 28, 2013
June 27, 2014
June 28, 2013
Net Income (as reported)
$ 46,916
$ 27,974
$ 104,949
$ 31,262
Adjustment:
Amortization of Acquisition- Related Customer Relationship Intangible Assets and Depreciation of Property and Equipment Resulting from the Transaction
28,526
38,698
98,864
116,399
Share-Based Compensation
11,311
3,507
33,444
12,328
Effect of Currency Translation
-
(543)
-
(4,563)
Severance and Other Charges
8,126
11,076
21,953
93,746
Effects of Acquisitions and Divestitures
(122)
(1,062)
(725)
(447)
Branding
4,634
-
19,486
-
Initial Public Offering-Related Expenses, including share-based compensation
-
-
56,133
-
Gains, Losses and Settlements impacting comparability
(1,406)
193
1,257
(13,257)
Effects of Refinancing on Interest and Other Financing Costs, net
-
-
25,705
39,830
Tax Impact of Adjustments to Adjusted Net Income
(20,172)
(20,488)
(96,161)
(91,774)
Adjusted Net Income
$ 77,813
$ 59,355
$ 264,905
$ 183,524
Adjustment:
Tax Impact of Adjustments to Adjusted Net Income and Interest Adjustments
20,172
20,488
70,456
51,944
Provision for Income Taxes
23,181
14,705
57,750
6,476
Interest and Other Financing Costs, net
71,186
80,917
256,613
341,392
Adjusted Operating Income
$ 192,352
$ 175,465
$ 649,724
$ 583,336
Adjustment:
Amortization of Acquisition- Related Customer Relationship Intangible Assets and Depreciation of Property and Equipment Resulting from the Transaction
(28,526)
(38,698)
(98,864)
(116,399)
Depreciation and Amortization
124,917
135,808
387,058
404,512
Adjusted EBITDA
$ 288,743
$ 272,575
$ 937,918
$ 871,449
Adjusted Earnings Per Share
Adjusted Net Income
$ 77,813
$ 59,355
$ 264,905
$ 183,524
Net Income Attributable to Noncontrolling Interests
(43)
(226)
(398)
(804)
Adjusted Net Income Attributable to Aramark Stockholders
$ 77,770
$ 59,129
$ 264,507
$ 182,720
Diluted Weighted Average Shares Outstanding
243,739
208,326
234,822
208,703
$ 0.32
$ 0.28
$ 1.13
$ 0.88
ARAMARK AND SUBSIDIARIES
RECONCILIATION OF NON-GAAP MEASURES
DEBT TO ADJUSTED EBITDA
(Unaudited)
(In thousands)
Twelve months ended
Twelve months ended
June 27, 2014
June 28, 2013
Net Income
$ 144,053
$ 90,680
Adjustment:
Loss from Discontinued Operations, net of tax
1,030
-
Amortization of Acquisition- Related Customer Relationship Intangible Assets and Depreciation of Property and Equipment Resulting from the Transaction
137,908
154,743
Share-Based Compensation
40,533
15,467
Effect of Currency Translation
-
(4,563)
Severance and Other Charges
42,639
93,746
Effects of Acquisitions and Divestitures
(278)
(447)
Branding
19,486
-
Initial Public Offering-Related Expenses, including share-based compensation
56,133
-
Gains, Losses and Settlements impacting comparability
4,263
(18,910)
Effects of Refinancing on Interest and Other Financing Costs, net
25,705
39,830
Tax Impact of Adjustments to Adjusted Net Income
(123,918)
(105,927)
Adjusted Net Income
$ 347,554
$ 264,619
Adjustment:
Tax Impact of Adjustments to Adjusted Net Income and Interest Adjustments
98,213
66,097
Provision for Income Taxes
70,507
12,641
Interest and Other Financing Costs, net
339,066
441,812
Adjusted Operating Income
$ 855,340
$ 785,169
Adjustment:
Amortization of Acquisition- Related Customer Relationship Intangible Assets and Depreciation of Property and Equipment Resulting from the Transaction
(137,908)
(154,743)
Depreciation and Amortization
524,682
537,757
Adjusted EBITDA
$ 1,242,114
$ 1,168,183
Debt to Adjusted EBITDA
Total Long-Term Borrowings
$ 5,689,709
$ 6,217,056
Adjusted EBITDA
$ 1,242,114
$ 1,168,183
Debt/Adjusted EBITDA
4.6
5.3
Explanatory Notes to the Non-GAAP Schedules
Amortization of acquisition related customer relationship intangible assets and depreciation of property and equipment resulting from the Transaction - adjustments to eliminate the change in amortization and depreciation resulting from the purchase accounting applied to the January 26, 2007 going-private transaction executed with investment funds affiliated with GS Capital Partners, CCMP Capital Advisors, LLC and J.P. Morgan Partners, LLC, Thomas H. Lee Partners, L.P. and Warburg Pincus LLC as well as approximately 250 senior management personnel.
Share-based compensation - adjustments to eliminate compensation expense related to the company's issuances of share-based awards and the related employer payroll tax expense incurred by the company when employees exercise in the money stock options or vest in restricted stock awards. This adjustment excludes the expense related to the modification of missed year options in connection with the initial public offering which are included in the Initial public offering and related expenses adjustment noted below. See Note 9 to the Condensed Consolidated Financial Statements contained in the company's Form 10-Q filing.
Effect of currency translation - adjustments to eliminate the impact that fluctuations in currency translation rates had on the comparative results by presenting the periods on a constant currency basis.
Severance and other charges - adjustments to eliminate severance expenses and other costs incurred in the applicable period such as costs incurred to start-up our Business Service Center in Nashville, TN ($6.0 million for the third quarter of 2014 and $18.1 million for the year-to-date 2014), organizational streamlining initiatives ($1.3 million expense reduction for the third quarter of 2014 and $0.5 million for the year-to-date 2014 and $7.7 million for the third quarter of 2013 and $54.6 million for the year-to-date 2013), goodwill impairments and asset write-offs ($0.1 million for the third quarter of 2013 and $23.2 million for the year-to-date 2013) and other transformational initiatives ($3.5 million for the third quarter and year-to-date 2014 and $3.3 million for the third quarter of 2013 and $15.9 million for the year-to-date 2013).
Effects of acquisitions and divestitures - adjustments to eliminate the impact that acquisitions and divestitures had on the comparative periods by only presenting the acquired or divested businesses for the same periods of time in each period of the comparison.
Branding - adjustments to eliminate the expenses incurred in the period for the Aramark rebranding, such as costs related to the logo redesign, painting of trucks, changing signage, advertising, an internal new brand roll-out meeting, including travel and lodging expenses for company employees to attend this meeting.
Initial public offering and related expenses - adjustments to eliminate non-cash compensation expense ($50.9 million for year-to-date 2014) related to the modification of missed year options in connection with the initial public offering, bonuses paid ($4.3 millionfor year-to-date 2014) to select senior management individuals related to the successful completion of the initial public offering and other costs attributable to the completion of the initial public offering.
Gains, losses and settlements impacting comparability - adjustments to eliminate certain transactions that are not indicative of our ongoing operational performance such as the loss on the McKinley Chalet divestiture ($6.7 million for year-to-date 2014), insurance reserve adjustments due to favorable claims experience ($1.9 million for the third quarter of 2014 and $5.8 million for the year-to-date 2014 and $4.5 million for the year-to-date 2013), multiemployer pension plan withdrawal charges ($2.1 million for the year-to-date 2013), wage and hour settlement ($2.8 million for the year-to-date 2013), other income relating to the recovery of the Company's investment (possessory interest) at one of the National Park Service sites ($14.2 million for the year-to-date 2013), expenses related to a secondary offering of common stock by certain of our stockholders in May of 2014 ($0.9 million for the third quarter and year-to-date 2014) and the impact of the change in fair value related to the gasoline and diesel agreements.
Effects of refinancing on interest and other financing costs, net - adjustments to eliminate expenses associated with refinancing activities undertaken by the Company in the applicable period such as third party costs and non-cash charges for the write-offs of deferring financing costs.
Forward-Looking Statements
This press release includes "forward-looking statements" within the meaning of the Private Securities Litigation Reform Act of 1995 that reflect our current views as to future events and financial performance with respect to, without limitation, conditions in our industry, our operations, our economic performance and financial condition, including, in particular, statements relating to our business and growth strategy. These statements can be identified by the fact that they do not relate strictly to historical or current facts. They use words such as "outlook," "aim," "anticipate," "are confident," "estimate," "expect," "will be," "will continue," "will likely result," "project," "intend," "plan," "believe," "see," "look to" and other words and terms of similar meaning or the negative versions of such words.
Forward-looking statements speak only as of the date made. All statements we make relating to our estimated and projected earnings, costs, expenditures, cash flows, growth rates and financial results are forward-looking statements. In addition, we, through our senior management, from time to time make forward-looking public statements concerning our expected future operations and performance and other developments. These forward-looking statements are subject to risks and uncertainties that may change at any time, and, therefore, our actual results may differ materially from those that we expected. We derive many of our forward-looking statements from our operating budgets and forecasts, which are based upon many detailed assumptions. While we believe that our assumptions are reasonable, we caution that it is very difficult to predict the impact of known factors, and, of course, it is impossible for us to anticipate all factors that could affect our actual results. All subsequent written and oral forward-looking statements attributable to us, or persons acting on our behalf, are expressly qualified in their entirety by the cautionary statements. Some of the factors that we believe could affect our results include without limitation: unfavorable economic conditions; natural disasters, global calamities, sports strikes and other adverse incidents; the failure to retain current clients, renew existing client contracts and obtain new client contracts; a determination by clients to reduce their outsourcing or use of preferred vendors; competition in our industries; increased operating costs and obstacles to cost recovery due to the pricing and cancellation terms of our food and support services contracts; the inability to achieve cost savings through our cost reduction efforts; our expansion strategy; the failure to maintain food safety throughout our supply chain, food-borne illness concerns and claims of illness or injury; governmental regulations including those relating to food and beverages, the environment, wage and hour and government contracting; liability associated with noncompliance with applicable law or other governmental regulations; changes in, new interpretations of or changes in the enforcement of the government regulatory framework; currency risks and other risks associated with international operations, including Foreign Corrupt Practices Act, U.K. Bribery Act and other anti-corruption law compliance; continued or further unionization of our workforce; liability resulting from our participation in multiemployer defined benefit pension plans; risks associated with suppliers from whom our products are sourced; disruptions to our relationship with, or to the business of, our primary distributor; the inability to hire and retain sufficient qualified personnel or increases in labor costs; healthcare reform legislation; the contract intensive nature of our business, which may lead to client disputes; seasonality; our leverage; the inability to generate sufficient cash to service all of our indebtedness; debt agreements that limit our flexibility in operating our business; potential conflicts of interest between certain of our controlling shareholders and us; and other factors set forth under the headings "Risk Factors," "Business - Legal Proceedings" and "Management Discussion and Analysis of Financial Condition and Results of Operations" sections in our prospectus dated December 11, 2013, filed with the SEC pursuant to Rule 424(b) of the Securities Act onDecember 12, 2013, as such factors may be updated from time to time in our periodic filings with the SEC, which are accessible on the SEC's website at www.sec.gov and which may be obtained by contacting Aramark's investor relations department via its websitewww.aramark.com. Accordingly, there are or will be important factors that could cause actual outcomes or results to differ materially from those indicated in these statements. These factors should not be construed as exhaustive and should be read in conjunction with the other cautionary statements that are included in this release and in our filings with the SEC. As a result of these risks and uncertainties, readers are cautioned not to place undue reliance on any forward-looking statements included herein or that may be made elsewhere from time to time by, or on behalf of, us. We undertake no obligation to publicly update or review any forward-looking statement, whether as a result of new information, future developments, changes in our expectations, or otherwise, except as required by law.
About Aramark
Aramark (NYSE: ARMK) proudly serves the world’s leading educational institutions, Fortune 500 companies, world champion sports teams, prominent healthcare providers, iconic destinations and cultural attractions, and numerous municipalities in 19 countries around the world with food, facilities, and uniform services. Because our culture is rooted in service, our employees strive to do great things for each other, our partners, our communities, and our planet. Aramark has been named to DiversityInc’s “Top 50 Companies for Diversity” list, the Forbes list of “America’s Best Employers for Diversity,” the HRC’s “Best Places to Work for LGBTQ Equality” and scored 100% on the Disability Equality Index. Learn more at www.aramark.com and connect with us on Facebook, Twitter, and LinkedIn.
Contacts:
Karen Cutler
215-238-4063
Investor Inquiries: Ian Bailey
215-409-7287

